Platform: The program that I used to create my infographic was Picktochart. I found the program very easy to navigate and the templates provided were user friendly and had lots of options for customizing.
Student Outcome: Communicate Ideas and Information – Use a combination of visual, print, and other media to effectively inform and engage the audience. I have chosen to use the same outcome.
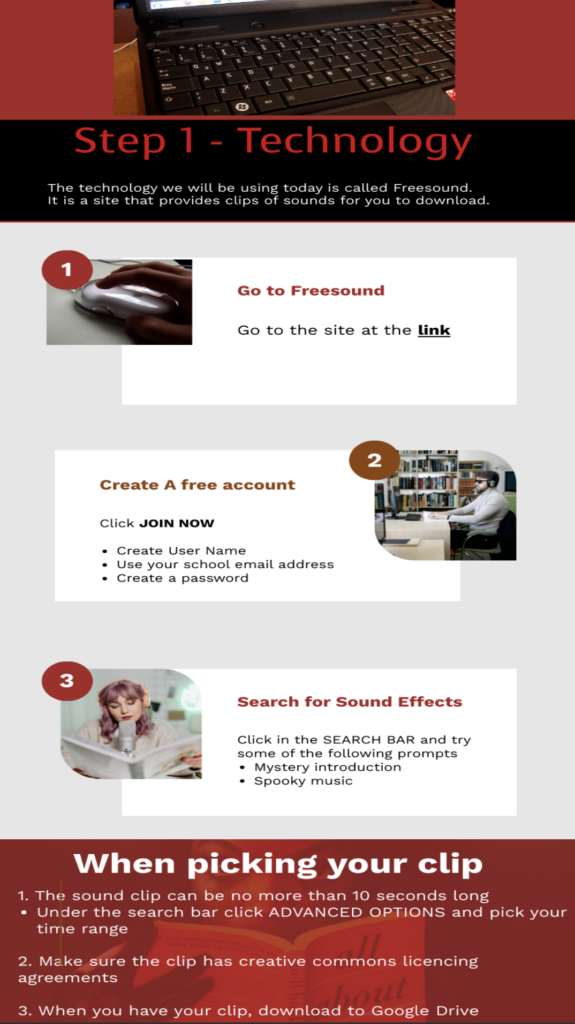
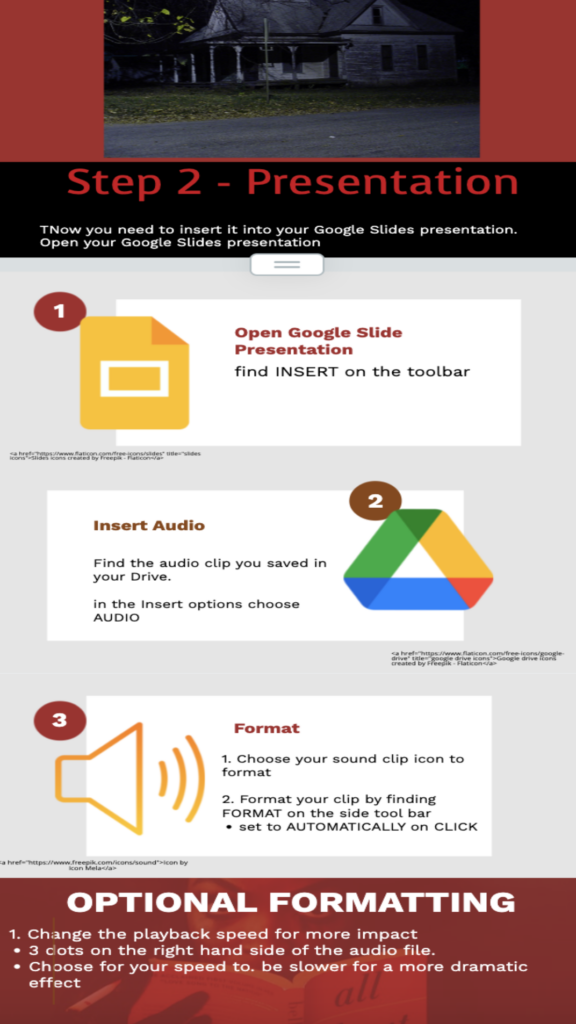
Design – The purpose of this infographic is to guide grade 7 students through the steps of successfully finding and embedding a sound clip into their audiobook presentations in Google Slides. To enhance clarity and engagement, I focused on using representational graphics as symbols by selecting realistic icons that align with students’ work. This approach supports independent learning by providing clear visual cues that reinforce understanding (Clark, 2009, p. 17).
In addition, I structured the information in a logical, step-by-step format, mirroring the sequence students need to follow to complete the task. This decision aligns with Clark’s concept that organizational visuals help represent the structure, process, and content of a lesson (2009, p. 19). By breaking the task into manageable steps and pairing each with a corresponding visual representation, the infographic reduces cognitive load and allows students to process information more efficiently.
What I determined while making this infographic is that the combination of realistic icons and an organized instructional flow makes the infographic an effective tool for independent self-directed learning as well as for students working in a classroom setting. Students can use it as a quick reference guide, reinforcing their understanding without relying on additional teacher support. This not only fosters independence but also helps accommodate different learning styles by integrating both visual and procedural elements.
Overall, this design approach enhances the infographic’s effectiveness by making the learning process more accessible, engaging, and intuitive for students.
Here are the samples of the two infographics I created for my lesson:
References
Clark, R. C. & Lyons, C. (2010). Three views of instructional visuals. In R. Taff (Ed.), Graphics for learning: Proven guidelines for planning, designing and evaluating visuals in training materials (2nd ed., pp. 15–28). Pfeiffer.
Leave a Reply
You must be logged in to post a comment.